
In Catchment's data, a third of social spend sits with one supplier. How solid is the data behind your claims?
Your ESG and community claims rest on figures your head contractors and their trade partners generate. Across $138.4 million of social procurement spend reported through Catchment, one third sits with a single supplier and 0.9% reaches disability enterprises. Here are five tests to put to the data before you publish it.
Why nowGreen Star Buildings v1.1 replaced v1 for new registrations from 1 May 2026 and renumbered the credits.
- Free to download
- Sources named in every paper
- No project or client identified
From the same data as "Social procurement: what the data tells us": 50 projects and 14.36 million labour hours.
- Ask where the social spend goesWhat a spend total does not tell you about how resilient it is.
- Ask for the volumesWhy a strong percentage can come from a very small number.
- Green Star v1.1 evidenceWhat changed for new registrations on 1 May 2026, and what it asks for.
- Modern slavery evidenceThe statement is yours. Much of the evidence sits in the supply chain.
- Approval commitmentsLocal jobs and community benefit promised at approval still need proof.
Your Copy Is Ready
Select the button below to open the PDF, then save a copy.
Download the PDFWant to talk through what it means for your projects?
Book a Demo →
Your claims are only as solid as your builders' data.
A developer rarely collects this data itself. It comes up from head contractors and their trade partners, then goes out under your name to investors, tenants, planning authorities and rating bodies. Across projects reporting through Catchment, most headline figures clear their benchmarks. What sits behind them is less even.
- Of all social procurement spend sits with a single supplier
- 1/3
- Of social spend reaches disability enterprises
- 0.9%
- Social procurement spend across the portfolio
- $138.4M
One shared view of what your builders committed to, and the evidence behind it.
Developers carry commitments to planning authorities, investors and communities that their builders deliver. On Catchment, each head contractor reports into a view you share.
Less rework for every report you owe
Head contractors report into a shared view, so Green Star, IS, board papers and investor reporting start from the same accepted data instead of fresh requests.
See how each builder is tracking
Across shared projects, see each builder's commitments against target, who is behind and where, on current data rather than at handover.
Commitments made at approval, tracked to the end
Planning conditions, investor commitments and community promises are set up once and tracked through delivery, with forecasts beside the targets.
Evidence for every audience you answer to
Figures reviewed and accepted, with the evidence beside them, for shareholders, planning authorities, Green Star, and the Scope 3 data AASB S2 reporting will ask for.
Six questions to ask your head contractors
Suppliers
How much of our social spend sits with the largest supplier?
Categories
What share reaches each type of social supplier?
Volumes
Would this percentage survive being printed as a count?
General information, not legal, planning or procurement advice. Requirements differ by project and contract; confirm them with your client.
Go deeper on the sector you bid in.
Each guide sets out what that sector's clients, policies and rating tools ask for, and what every package needs ready.
 Data centresBidding for data centres? Five things data centre clients need to see.Free download →
 BuildingGreen Star and Victoria's Local Jobs First changed in 2026. Five things building contracts ask for.Free download →
 CommercialGreen Star's credit numbers changed. Five things a commercial client will ask for.Free download →
 EducationTerm dates are fixed. So are the reporting deadlines. Five things an education build asks for.Free download →
 InfrastructureA Victorian Local Jobs First miss now follows you. Five things infrastructure contracts ask for.Free download →
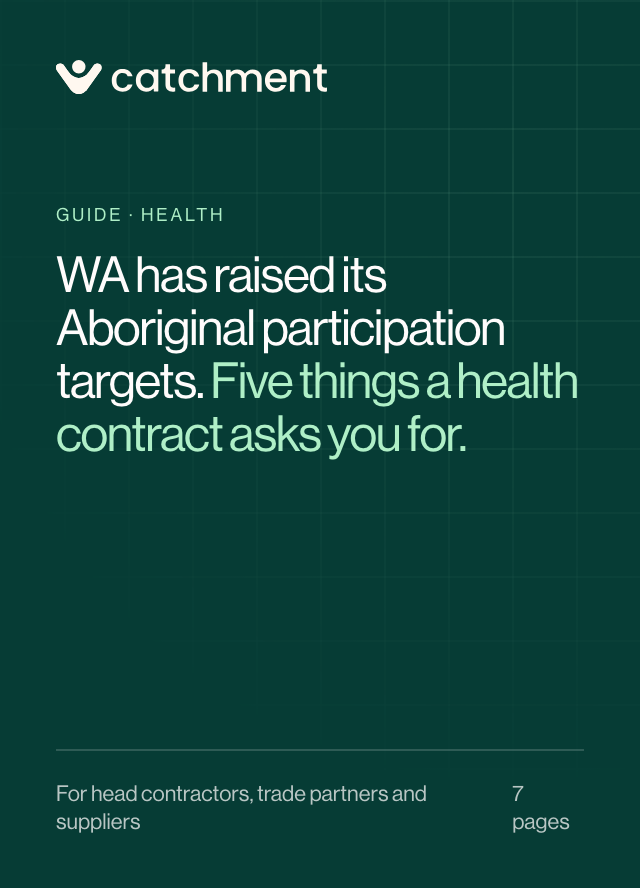 HealthWA has raised its Aboriginal participation targets. Five things a health contract asks you for.Free download →
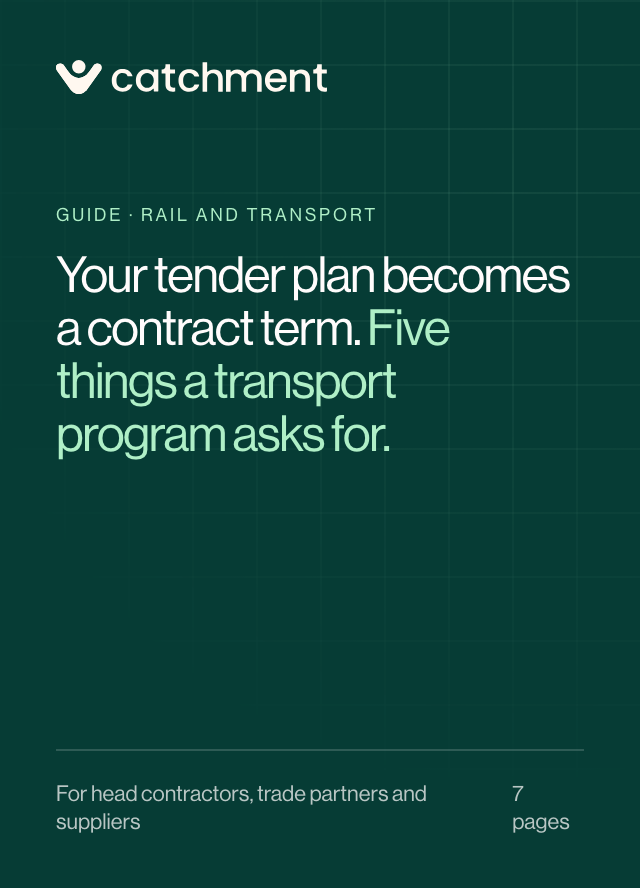 Rail and transportYour tender plan becomes a contract term. Five things a transport program asks for.Free download →
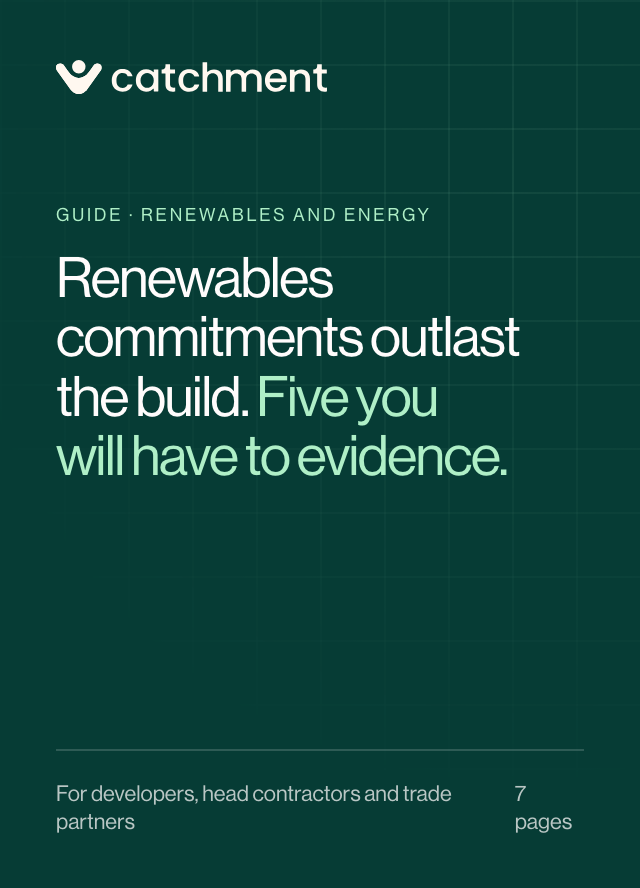 Renewables and energyRenewables commitments outlast the build. Five you will have to evidence.Free download →
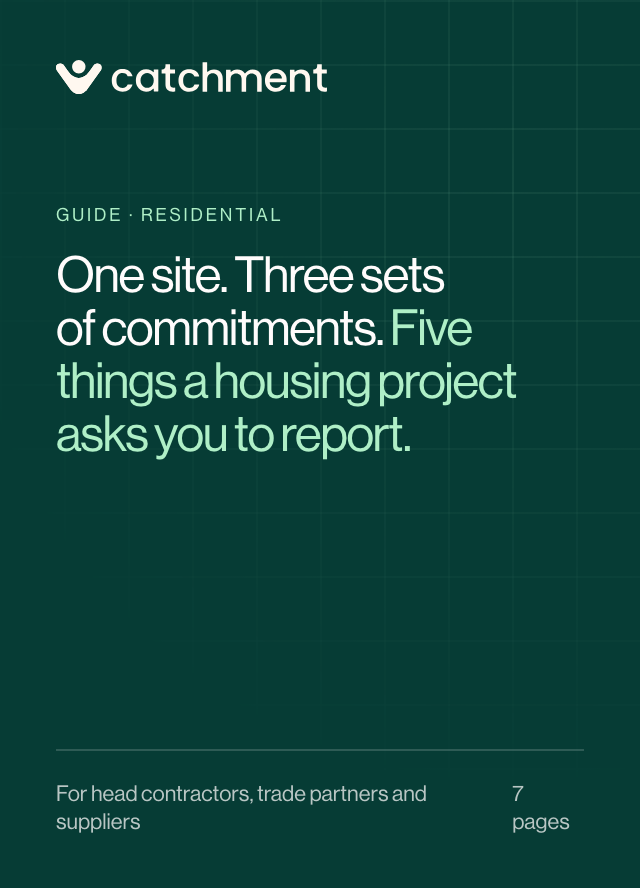 ResidentialOne site. Three sets of commitments. Five things a housing project asks you to report.Free download →